Donald C. Hood, PhD, is the James F. Bender Professor of Psychology and Professor of Ophthalmic Sciences at Columbia University in New York, New York. His work has focused on improving the utility of optical coherence tomography (OCT) imaging in glaucoma treatment. He lectures on the lessons he has learned about the use of OCT, and how these lessons can aid the clinician in understanding and diagnosing glaucoma. Here, Glaucoma Physician talks with Dr. Hood about myths he believes glaucoma specialists hold about OCT for glaucoma.
Q: How is OCT currently used in glaucoma management?
A: Optical coherence tomography is an incredible technology, but many glaucoma specialists are not making optimal use of it. For example, many do not look at the actual OCT image. An OCT image (also known as a B-scan) has a hundred times the resolution of an MRI or CAT scan. Glaucoma specialists are not making optimal use of OCT if they do not look at these scan images, especially the image around the disc. A second problem is that many depend on the summary statistics, rather than looking at thickness and/or deviation/probability maps.1,2
Q: You say there are myths about OCT for glaucoma. For example, is it generally believed that you can’t use OCT for high myopes?
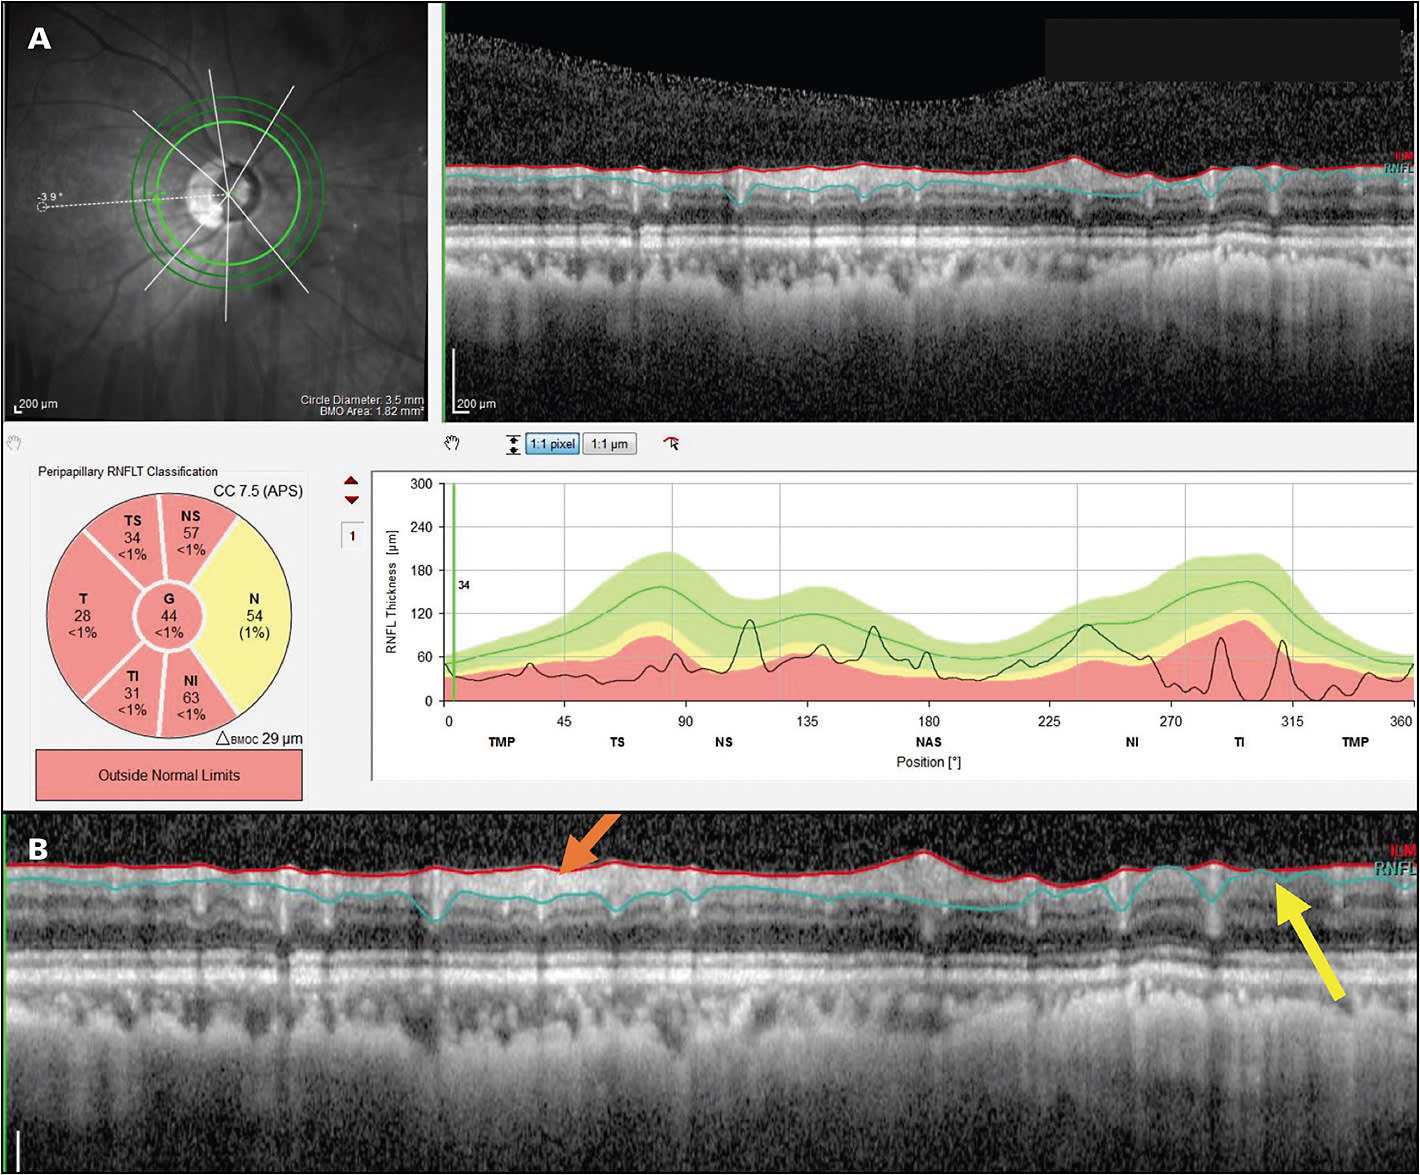
A: Yes. A common assumption is that you can’t test individuals with high myopia with OCT because the standard summary statistics used for OCT interpretation are based on norms from individuals who don’t have high myopia. However, while it is true that the summary statistics cannot be trusted in such cases, it is possible to evaluate glaucomatous damage in many high myopes. The key is looking at the B-scan image around the disc, the so-called circumpapillary retinal nerve fiber (RNFL) image. In most eyes with high myopia, it is relatively easy to identify glaucomatous damage. A study we published recently looked at 100 high myopes to determine whether glaucomatous damage can be accurately diagnosed in high myopes by assessing OCT results. In 97 of 100, we were able to correctly determine if the eye was healthy or glaucomatous based on the OCT image, without making use of the summary statistics.3
Q: How do you recommend ophthalmologists get started with OCT for a highly myopic patient?
A: All of the available OCT platforms offer reports. Every OCT scan of the disc has a B-scan image showing the RNFL around that disc. You want to look at this image (Figure 1). While you may not be able to trust the summary statistics, such as global thickness, you can see local damage on the image, as well as the regions with and without RNFL tissue remaining (Figure 1B). Another important concept is the deviation or probability maps. All OCT instruments now have a deviation or probability map that shows where the RNFL is abnormal and where the ganglion cells are abnormal. In many patients, even high myopes, these can be useful. Some patients have other kinds of problems, for example, peripapillary atrophy, that is so bad that it makes OCT difficult to use even with B-scan images and probability maps. So it’s not for all patients, but for many, if not most, high myopes, OCT will be useful.

Q: Is another myth that you can’t use OCT images for advanced glaucoma?
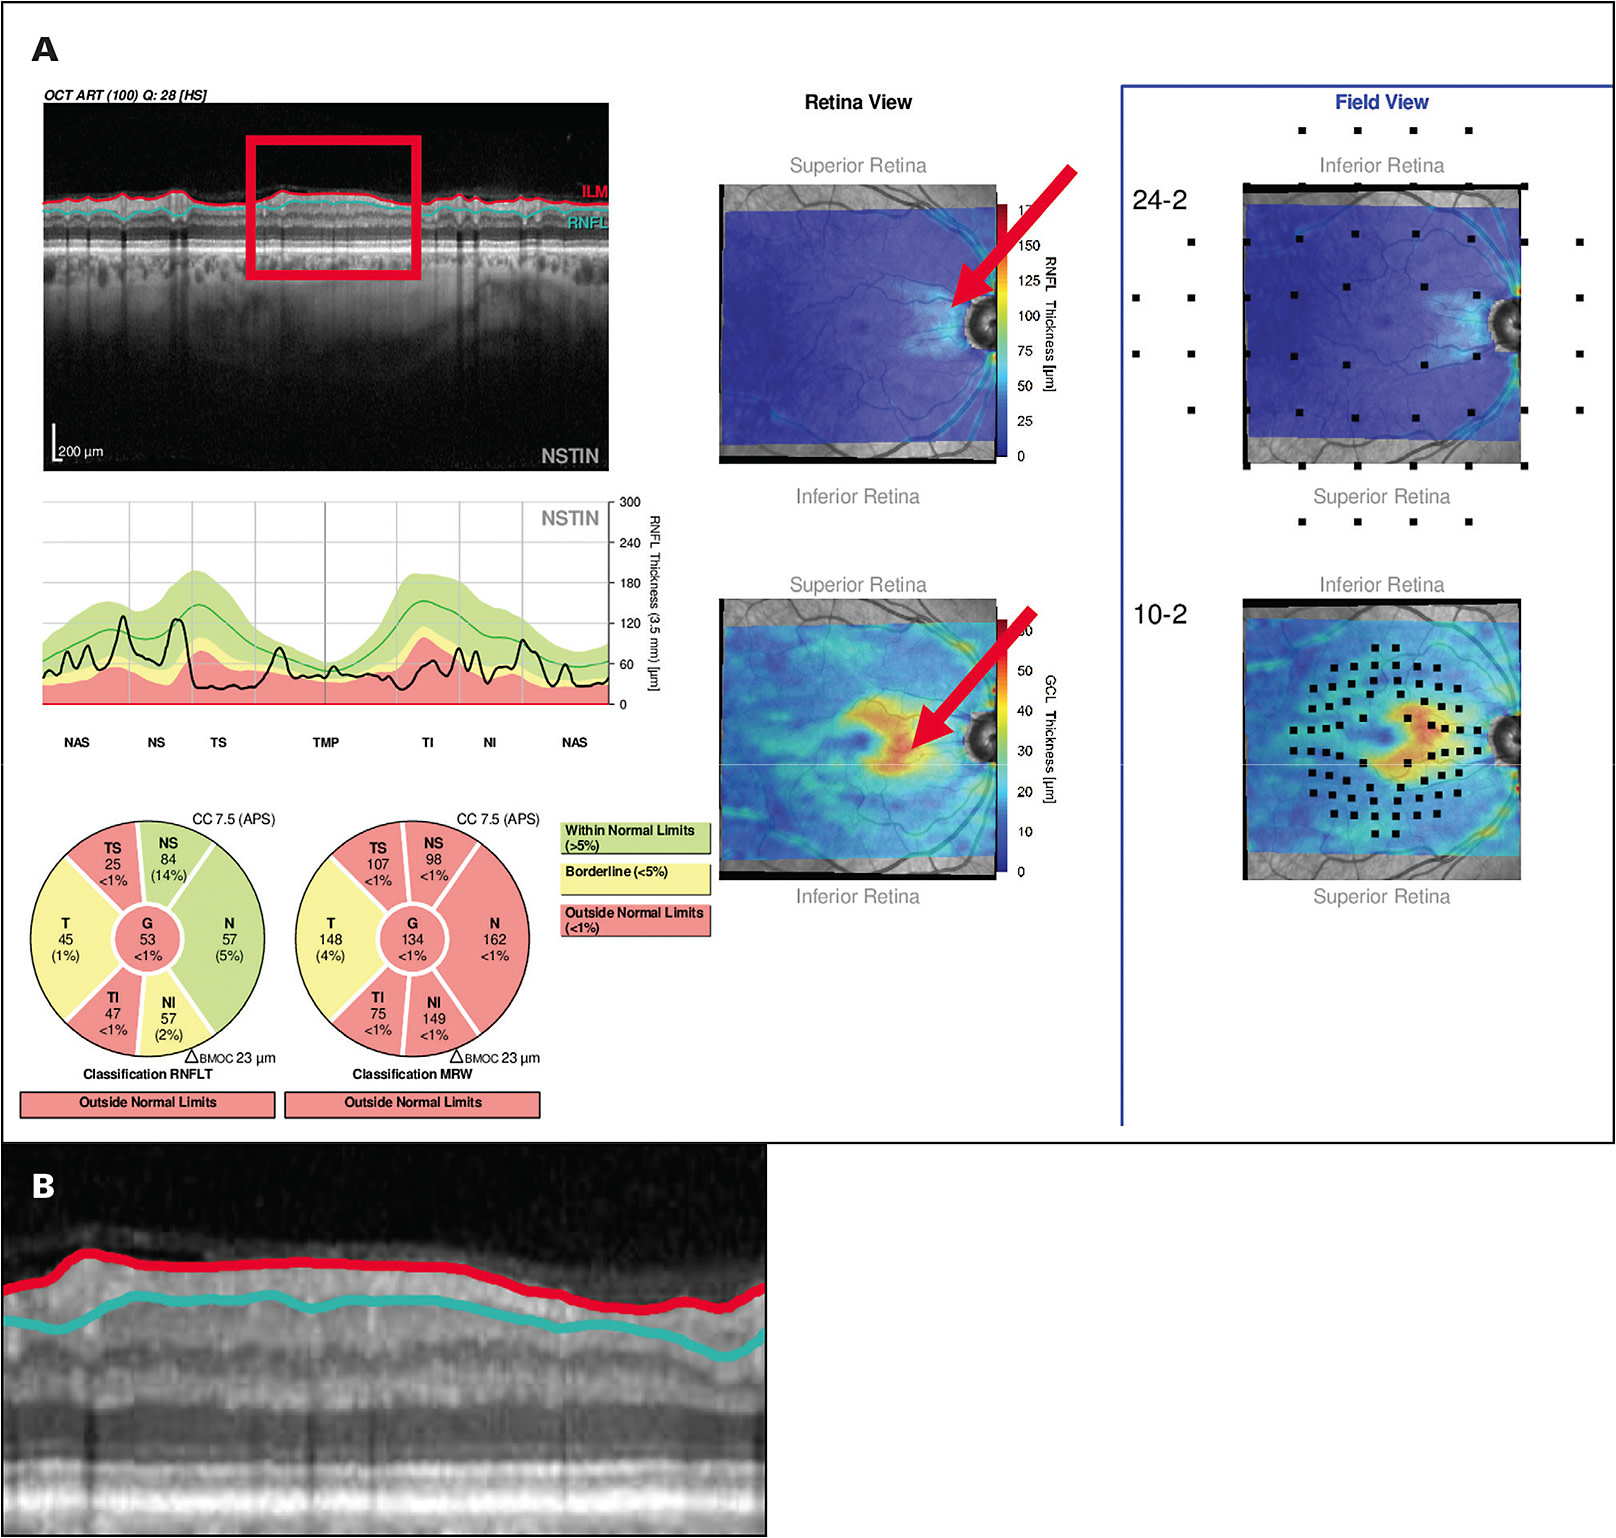
A: Yes. Many clinicians believe that if the average circumpapillary RNFL thickness, a common summary statistic, is less than about 50 µm to 60 µm, then OCT cannot be used to study or follow eyes with high myopia. While this is true for summary statistics, it is not true if you look at the B-scan image. Figure 2 shows an OCT report illustrating how preserved RNFL can be seen on OCT images in many eyes with advanced glaucoma. Our rule of thumb is that if you have any points remaining on your 10-2 visual field or your 24-2 visual field better than -8 dB, then some RNFL tissue is remaining, and you will be able to follow that remaining RNFL with an OCT.1,2,4

Q: Another myth is that before you can see functional damage, meaning changes in the visual field, you have to lose 25% of your ganglion cells.
A: Optical coherence tomography doesn’t always agree with the visual field, especially if you’re using summary statistics. However, if you compare local visual field loss seen on 10-2 and 24-2 visual fields with local OCT loss, then structure and function, meaning visual fields and OCT, go together beautifully.5 We now have lots of evidence for this, and we even have an automated procedure for assessing this argreement.6 Further, as we have recently described,7 the misbelief that visual field changes require a loss of 25% of the ganglion cells is based upon a misreading of the literature, as I detailed in a recent article.7
Q: And some clinicians believe that it takes multiple OCT tests to assess glaucoma progression.
A: Yes. Because visual fields are so variable, basic clinical scientists, as well as clinicians and industry, have developed elaborate procedures that involve multiple tests. This method does not allow you to say, “glaucoma is progressing” unless you have at least 4 or 5 tests.8 However, in many cases, you can reliably identify progression with one follow-up OCT, again, if you look at images and deviation/probability maps.8
Q: What has changed in the way OCT reports are displayed?
A: Several companies have incorporated the work we have done to allow the clinician to make a faster and more accurate diagnosis. Both Topcon and Heidelberg have “Hood Reports” that are based upon our work and incorporate the B-scan images and probability maps mentioned earlier. Figure 2A shows an example. These reports are based upon over 10 years of working with ophthalmologists.9-11 The reports also have 24-2 and 10-2 visual field locations superimposed to make it easy to compare the visual field to the OCT. Use of such reports will help the clinician avoid the dangers inherent in the myths we have been discussing. GP
Editor’s note: For access to Dr. Hood’s lectures and articles, visit https://hoodvisualscience.psychology.columbia.edu .
References
- Hood DC, De Moraes CG. Four questions for every clinician diagnosing and monitoring glaucoma. J Glaucoma. 2018 Aug;27(8):657-664. doi:10.1097/IJG.0000000000001010
- Hood DC, De Moraes CG. Challenges to the common clinical paradigm for diagnosis of glaucomatous damage with oct and visual fields. Invest Ophthalmol Vis Sci. 2018;59(2):788-791. doi:10.1167/iovs.17-23713
- Zemborain ZZ, Jarukasetphon R, Tsamis E, De Moraes CG, Ritch R, Hood DC. Optical coherence tomography can be used to assess glaucomatous optic nerve damage in most eyes with high myopia. J Glaucoma. 2020;29(10):833-845. doi:10.1097/IJG.0000000000001631
- Lee SH, Joiner DB, Tsamis E, et al. OCT circle scans can be used to study many eyes with advanced glaucoma. Ophthalmol Glaucoma. 2019;2(3):130-135. doi:10.1016/j.ogla.2019.02.004
- Hood DC, Tsamis E, Bommakanti NK, et al. Structure-function agreement is better than commonly thought in eyes with early glaucoma. Invest Ophthalmol Vis Sci. 2019;60(13):4241-4248. doi:https://doi.org/10.1167/iovs.19-27920
- Tsamis E, Bommakanti NK, Sun A, Thakoor KA, Moraes CGD, Hood DC. An automated method for assessing topographical structure–function agreement in abnormal glaucomatous regions. Transl Vis Sci Technol. 2020;9(4):14. doi:10.1167/tvst.9.4.14
- Hood DC. Does retinal ganglion cell loss precede visual field loss in glaucoma? J Glaucoma. 2019;28(11);945-951. doi:10.1097/IJG.0000000000001380
- Hood DC, Melchior B, Tsamis M, Liebmann JM, De Moraes, CG. Did the OCT show progression since the last visit? J Glaucoma. December 16, 2020. doi:10.1097/IJG.0000000000001766
- Hood DC, Raza AS. On improving the use of OCT imaging for detecting glaucomatous damage. Br J Ophthalmol. 2014;98 Suppl 2(Suppl 2):ii1-9. doi:10.1136/bjophthalmol-2014-305156
- Hood DC, De Cuir N, Blumberg DM, et al. A Single Wide-field OCT protocol can provide compelling information for the diagnosis of early glaucoma [published correction appears in Transl Vis Sci Technol. 2017 Jan 5;6(1):2]. Transl Vis Sci Technol. 2016;5(6):4. doi:10.1167/tvst.5.6.4
- Hood DC. Improving our understanding, and detection, of glaucomatous damage: an approach based upon optical coherence tomography (OCT). Prog Retin Eye Res. 2017;57:46-75. doi:10.1016/j.preteyeres.2016.12.002


