


Spectral-domain optical coherence tomography (SD-OCT) of the peripapillary retinal nerve fiber layer (RNFL) and ganglion cell complex (GCC) have become an invaluable supplement to clinical examination and perimetry in diagnosing glaucoma and monitoring for disease progression. OCT RNFL and GCC provide an objective, quantifiable, and reproducible means of assessing the thickness of the neuroretinal rim and inner macular layers, respectively. These tools are particularly helpful in cases of early, preperimetric glaucoma and for patients who are unable to reliably perform visual field testing.
However, this important technology is not without its limitations. One retrospective study found at least 1 artifact in nearly half (46%) of more than 2,000 OCT RNFL scans.1 Misinterpretation of OCT RNFL images containing artifacts can lead to misdiagnosis and undertreatment or overtreatment of glaucoma. This article will provide an overview on interpreting OCT RNFL reports to avoid missing errors, review common OCT RNFL artifacts, and provide real-world examples of such confounders.
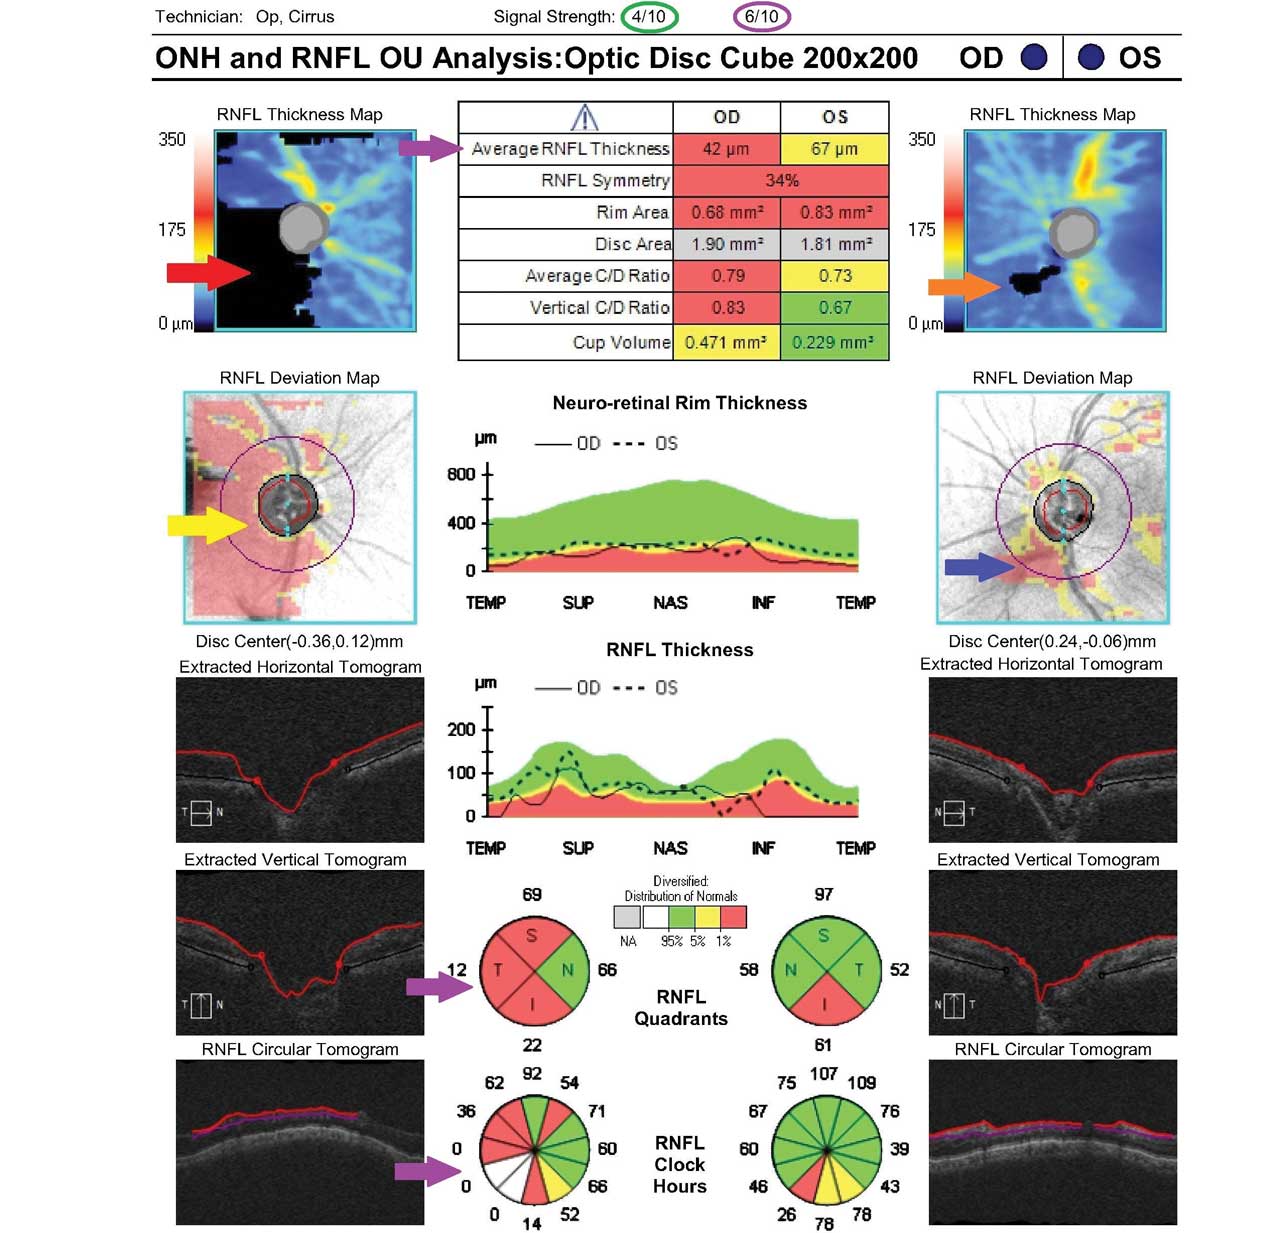
Figure 1. In this Cirrus optical coherence tomography (OCT) image of the retinal nerve fiber layer (RNFL), a visually significant cataract in the right eye contributes to a poor signal strength of 4/10 (green circle). A missing data artifact contained within the scan circle, denoted by black in the RNFL thickness map (red arrow) and red in the RNFL deviation map (yellow arrow), results in artifactually low average and sectoral RNFL thickness values (purple arrows). The left eye also shows a focal reduction in signal strength (purple circle) due to a posterior vitreous detachment (orange and blue arrows).
OCT Platforms and Printouts
Several different SD-OCT machines are commercially available, but this article will focus on 2 common platforms: the Cirrus (Carl Zeiss Meditec) and Spectralis (Heidelberg Engineering GmbH).
Retinal nerve fiber layer thickness values are not interchangeable across different OCT devices. As a result, comparing data from different machines for the same patient can lead to inaccurate assessments and potential misidentification of disease progression. When a new patient has been previously monitored in another practice using a different OCT platform, clinicians should establish a new baseline and obtain serial imaging with their own device to accurately evaluate progression.
When reviewing an OCT RNFL “printout,” first assessing the quality of the scan is essential. For the Cirrus OCT RNFL, a signal strength greater than 6 is typically considered adequate, whereas for the Spectralis OCT RNFL, a quality index (denoted by “Q” on the report) greater than 15 is usually acceptable. Decreased numerical quality indices resulting from media opacities such as dry eye syndrome and cataract may lead to artifactually low RNFL thickness values (Figure 1), which can in turn lead to erroneous diagnoses and misidentification of progression. Simple maneuvers like reminding patients to blink prior to image acquisition or administering artificial tears are helpful in reducing artifact related to ocular surface disease.
Clinicians should also assess the position of the scan circle in relation to the optic nerve to ensure correct centration. RNFL thickness is greater closer to the optic nerve and decreases further away, so a decentered scan circle may falsely suggest glaucomatous progression in the sectors that are furthest away from the circle because they will appear artifactually thinner.
Each OCT RNFL platform provides a wealth of summary statistics designed to assist the clinician in diagnosing and monitoring glaucoma. It’s important to look beyond the average RNFL thickness and examine all the data points provided to avoid diagnostic errors. Clinicians should inspect the RNFL thickness values provided for quadrants and individual sectors, RNFL thickness and deviation maps, B-scan tomograms, temporal-superior-nasal-inferior-temporal (TSNIT) plots, and macular scans. Several real-world clinical scenarios are provided below, demonstrating how different types of artifacts affect these various parameters.
Cirrus and Spectralis OCT RNFL and GCC reports use color coding to denote normal RNFL thickness (green) vs borderline (yellow) or abnormal (red) degrees of RNFL thinning based on comparisons to normative databases, which differ across platforms. Artifacts may result in false positives (known as “red disease”), whereby RNFL sectors that are normal are mistakenly flagged as red, leading to erroneous interpretations by the clinician and, in some cases, unnecessary treatment. A quick glance at an OCT RNFL printout or progression analysis during a busy clinic session can easily result in overlooking an artifact causing “red disease.” I sometimes see patients seeking a second opinion regarding a new glaucoma diagnosis for which treatment has been recommended by a prior provider, only to discover a missed artifact on previous OCT RNFL imaging.
Although OCT machines are highly sensitive in discerning abnormalities of the RNFL, a good general rule of thumb is to ensure that the information provided by the OCT RNFL report agrees with the overall clinical picture. In the absence of structure-function correlation, it helps to go back and review the OCT RNFL report for artifacts (or consider a diagnosis other than glaucoma, depending on the context). Although time-consuming and not always practical, reviewing raw OCT data rather than relying on summary statistics and color coding alone can facilitate the recognition of artifacts.

Figure 2. Spectralis OCT RNFL in a myopic eye demonstrates artifact arising from peripapillary atrophy, which crosses the scan circle and results in artifactually thin RNFL values. Note the erroneous RNFL thickness values at, or near, zero in the TSNIT plot (black arrows) and sector analysis (blue arrows).
Common Sources of OCT RNFL Artifacts
Advancements in OCT technology since its introduction in 1991 have vastly improved image quality and software analysis algorithms. Modern OCT machines include eye tracking technology that reduces motion artifacts resulting from a patient’s eye movements. In addition, newer platforms offer automated identification of anatomic landmarks (ie, the fovea and Bruch’s membrane opening) to maintain consistent alignment between baseline and subsequent scans, improving precision and reproducibility. However, OCT RNFL artifacts can still arise during data acquisition due to operator error or from patient movement. Thorough training of technician staff is important to avoid errors and facilitate the acquisition of high-quality, accurate scans. If technicians are well trained to immediately recognize poor quality scans or missing data artifacts, they can obtain repeat imaging while patients are still seated at the machine, thereby optimizing the efficiency of office visits.
Many artifacts result from the presence of ocular comorbidities. High myopia presents a unique challenge in obtaining reliable OCT RNFL scans. Normative databases do not include eyes with high myopia, and highly myopic eyes tend to have thinner average RNFL independent of glaucoma. OCT machines will therefore frequently flag the RNFL as abnormal in high myopes with normal optic nerves. Anatomic features like peripapillary atrophy (PPA) and optic nerve head tilt and torsion can further confound OCT RNFL results in high myopes. For example, PPA in myopic eyes can result in red disease, especially if the scan circle is misaligned and/or crosses an area of atrophy (Figure 2). In some cases, using the outermost (rather than the innermost) scan circle can circumvent such errors, because it may be less influenced by the presence of PPA. Of note, any RNFL measurements at, or near, zero (as seen in Figure 2) should alert the clinician to the likelihood of an artifact. Even in eyes with advanced loss of retinal ganglion cell axons, a measurement “floor” exists below which the RNFL thickness will not decline further, due to the presence of residual glial cells and blood vessels. Usually, at this point, OCT RNFL is no longer useful for monitoring glaucomatous progression, though GCC may still offer some benefit. Notably, RNFL “floor” values differ among different OCT platforms, approximating 57 µm with the Cirrus machine and 49 µm with the Spectralis,2 but they will never be zero.

Figure 3. Significant segmentation artifact is seen in the circumferential OCT scans and TSNIT plots in this highly myopic patient’s Spectralis OCT RNFL.
Segmentation errors (or failure of the software algorithm to properly identify the borders of the RNFL) are also very common in high myopes due to abnormalities like retinoschisis, vitreopapillary traction, and staphylomas (Figure 3). Additionally, with increasing axial length, the superotemporal and inferotemporal RNFL bundles have a more temporal orientation, leading to thinner nasal sectors and thicker temporal sectors on the OCT RNFL in myopic eyes (Figure 4).3 Nasal RNFL thinning is not typical for glaucoma, which instead is associated with RNFL thinning of the inferior and superior sectors. Therefore, rather than relying solely on an OCT machine’s color coding to diagnose glaucoma in moderate-to-high myopes, comparing subsequent scans to a patient’s own baseline is more helpful.

Figure 4. This Spectralis OCT RNFL shows apparent nasal thinning (blue arrows) resulting from more temporally oriented superotemporal and inferotemporal RNFL bundles, a common finding in myopic eyes. Note the “supranormal” RNFL thickness in the temporal regions in the TSNIT plot (black arrows).
Evolving posterior vitreous detachments (PVD) are a common source of RNFL artifacts (Figure 5). One study using the Cirrus OCT RNFL demonstrated that a PVD contained within the scan circle resulted in the impression of RNFL thinning.4 Other studies using Spectralis OCT RNFL have shown an artifactually thicker RNFL in the setting of a PVD.1,5 An impending PVD may exert traction on the internal limiting membrane, causing a falsely thick RNFL measurement, and its subsequent separation may mimic RNFL progression. Similarly, uveitis may cause edema of the RNFL and macula, leading to a false sense that a glaucomatous optic nerve is normal. Only after the resolution of inflammation will RNFL thinning become evident, highlighting the importance of obtaining new baseline OCT RNFL scans after treating uveitis.
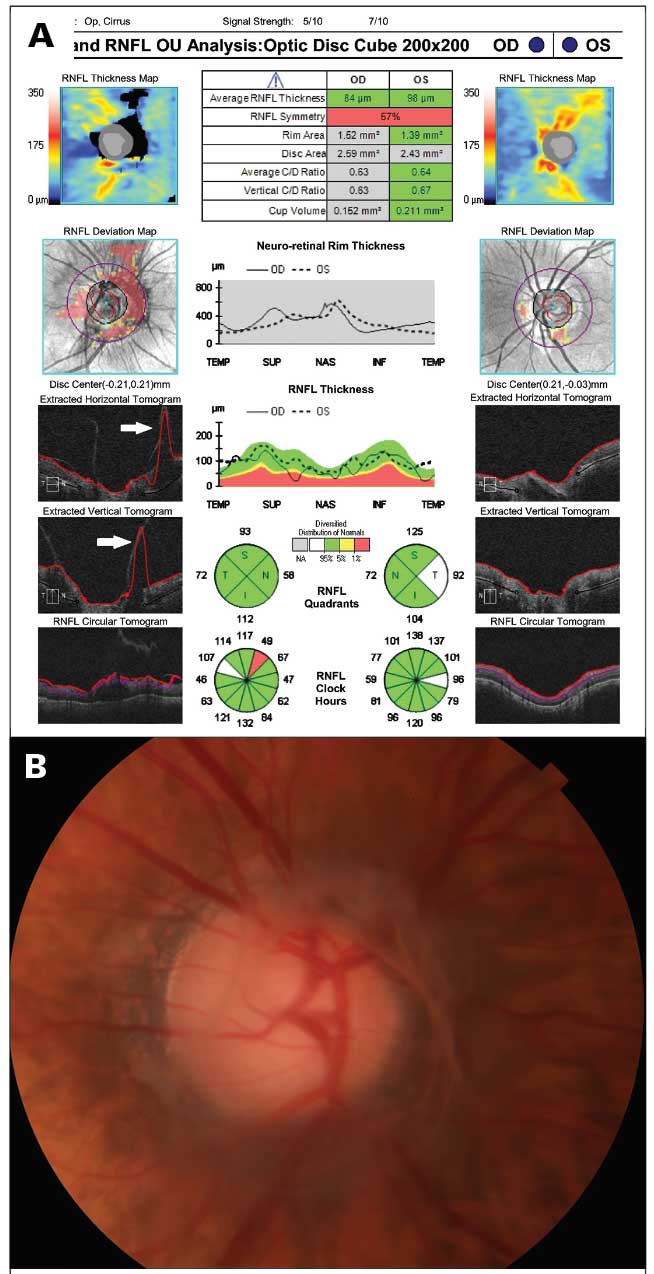
Figure 5. An impending posterior vitreous detachment (PVD) in the right eye (A) produces a missing data artifact contained within the scan circle of this Cirrus OCT RNFL, denoted by black in the RNFL thickness map and red in the RNFL deviation map. Note the segmentation errors in the tomograms (white arrows). (B) Disc photo from the same patient demonstrating the impending PVD.
Although some macular pathology (like epiretinal membrane, cystoid macular edema, and vitreomacular traction) can cause an artifactually “supranormal” RNFL and lead to a missed diagnosis of glaucoma or mask glaucomatous progression, others (like retinal vascular occlusion without edema, geographic atrophy, and panretinal photocoagulation) can produce a thinner RNFL and masquerade as glaucoma. Attention should be paid to the macular scans included on OCT RNFL and GCC printouts, which will alert the clinician to macular pathology as a potential source of artifacts. Epiretinal membranes (ERM) are a frequent source of error, because the OCT software algorithm may misidentify the upper limit of the ERM as the internal limiting membrane, resulting in a measured “RNFL” value that is artifactually thicker. Vitreomacular traction can cause similar artifacts due to erroneous segmentation of the borders of the RNFL (Figure 6). In some cases, such errors can result in misclassification of a glaucomatous optic nerve as being “within normal limits” by the Spectralis OCT software, underscoring the importance of interpreting automated classifications with caution.

Figure 6. Misidentification of the internal limiting membrane (white arrow) in this Spectralis OCT RNFL obtained from a patient with vitreomacular traction in the left eye leads to an artifactually thicker RNFL measurement. Note the erroneously thick RNFL values in the TSNIT plot (black arrows).
Conclusion
OCT RNFL has revolutionized our ability to diagnose early glaucoma and monitor patients for disease progression. However, operator error and comorbid ocular conditions frequently contribute to artifacts in OCT RNFL imaging. Vigilant interpretation of OCT scans and longitudinal follow-up with serial imaging in patients with uveitis and vitreoretinal pathologies are important to discern true glaucomatous progression from RNFL thinning resulting from evolution or resolution of these ocular comorbidities. An overreliance on software-generated analyses and color coding provided on OCT RNFL printouts can lead to underdiagnosis or overdiagnosis and undertreatment or overtreatment of glaucoma. Continued advancements in OCT technology, thorough training of technician staff, and a methodical approach to analyzing OCT RNFL printouts will allow eyecare providers to avoid the pitfalls associated with overlooking artifacts. GP

References
1. Liu Y, Simavli H, Que CJ, Rizzo JL, Tsikata E, Maurer R, Chen TC. Patient characteristics associated with artifacts in Spectralis optical coherence tomography imaging of the retinal nerve fiber layer in glaucoma. Am J Ophthalmol. 2015;159(3):565-576.e2. doi:10.1016/j.ajo.2014.12.006
2. Mwanza JC, Kim HY, Budenz DL, et al. Residual and dynamic range of retinal nerve fiber layer thickness in glaucoma: comparison of 3 OCT platforms. Invest Ophthalmol Vis Sci. 2015;56(11):6344-6351. doi:10.1167/iovs.15-17248
3. Leung CK, Yu M, Weinreb RN, et al. Retinal nerve fiber layer imaging with spectral-domain optical coherence tomography: interpreting the RNFL maps in healthy myopic eyes. Invest Ophthalmol Vis Sci. 2012 Oct 17;53(11):7194-7200. doi:10.1167/iovs.12-9726
4. Aref AA, Budenz DL. Spectral domain optical coherence tomography in the diagnosis and management of glaucoma. Ophthalmic Surg Lasers Imaging. 2010;41 Suppl:S15-S27. doi:10.3928/15428877-20101031-01
5. Asrani S, Essaid L, Alder BD, Santiago-Turla C. Artifacts in spectral-domain optical coherence tomography measurements in glaucoma. JAMA Ophthalmol. 2014;132(4):396-402. doi:10.1001/jamaophthalmol.2013.7974